Surface Data Visualization

csdetb-icono

Customer

This is an Industrial Automation and Robotics Solutions provider company, especially in the manufacturing sector in the market of UAE and the Middle East.

Project Details

  • Duration: 2+ Months

Technologies:

  • Python
  • MSSQL
  • Plotly
  • PyQT
problem-img

Problem

  • Manual inspection of surface pits is highly complex and inefficient.
  • Visualizing and interpreting high volume sensor data visualization from laser hardware is difficult. Especially when analyzing thousands of readings for small areas.
  • Lack of a user-friendly data visualization platform limits actionable insights. It is for engineers and technicians.
solution-img

Solution

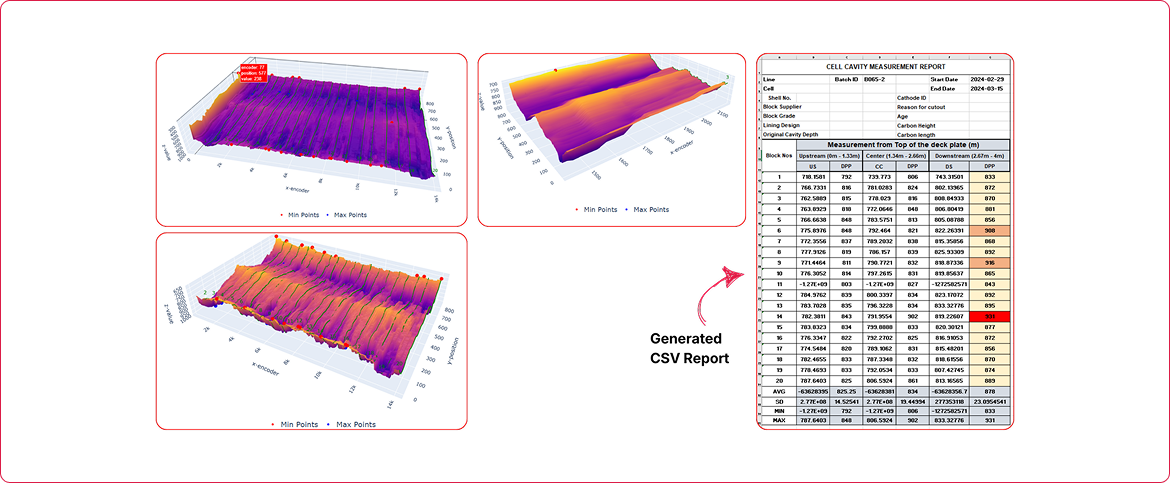
We developed a desktop-based 3D data visualization and analysis tool for surface pit evaluation.

  • Utilizes automated surface inspection techniques. It is to highlight variations in pit depths.
  • Integrates 3D surface inspection logic. It visually represents depth levels using a heatmap (deepest in red, shallowest in blue)
  • Supports batch-wise filtering and interactive view of specific cathodes.
  • Offers the ability to select and explore individual or multiple units.
  • The tool can also adapt to automated scanning and inspection workflows. It is developed in alignment with robotics in manufacturing.

CSV Report
Deepest points in each cathode.
Average depth, standard deviation, etc.

Implementation-Challenges

Implementation Challenges

  • Rendering large datasets quickly and accurately in 3D.
  • Mapping depth variations across multiple surface cathodes.
  • Building an intuitive UI for high density data visualization applications.
  • Ensuring smooth integration with existing laser surface inspection tools.
  • Aligning depth data with surface dimensions for meaningful visuals.
Key-Features

Key Features

  • Real-time 3D graph rendering from point cloud surface data.
  • Intuitive heatmap based display for quick interpretation of depth differences.
  • Batch filtering and selection tools for granular analysis.
  • Adaptability to laser inputs from laser surface inspection hardware.
  • Flexible architecture for future integration with robotics in manufacturing.
  • Simplified interface within a powerful data visualization application.

Insights on innovation

Stay updated with the trending and most impactful tech insights. Check out the expert analyses, real-world applications, and forward-thinking ideas that shape the future of AI Computer Vision and innovation.

March 25, 2026 - 7 minutes to read

How AI-Powered OCR is Revolutionizing Reefer Yard Management

Busy container terminal at 6 AM. Trucks queuing at the gate, vessels berthing, yard equipment moving in every direction, and somewhere in the middle of all that organized chaos, a gate clerk squinting at a container number that’s half-obscured by road grime, trying to type it correctly into a system that will not forgive a […]

Read More

Ruchir Kakkad

CEO & Co-founder

March 24, 2026 - 6 minutes to read

The Future of Cold Chain Logistics Automating Reefer Temperature Monitoring

There’s a strawberry sitting in a warehouse in a port somewhere in Europe right now. It was picked three days ago. And if someone doesn’t know exactly what temperature it’s been kept at for the last 72 hours, that strawberry, and about 40,000 others just like it, might be quietly rotting. Nobody talks about that […]

Read More

Ruchir Kakkad

CEO & Co-founder

March 6, 2026 - 5 minutes to read

The Real Cost of Blind Spots in Supply Chains (and How Visual Recordkeeping solves them)

At midnight, a high value shipment enters a regional logistics hub. By morning, the factory waited for those parts to halt production. The system shows the shipment as “received.” The yard team insists it was unloaded. The transporter says it left in perfect condition. No one is lying. No one can prove anything either. This […]

Read More

Ruchir Kakkad

CEO & Co-founder

Whatsapp Img