Customer
This is an Industrial Automation and Robotics Solutions provider company, especially in the manufacturing sector in the market of UAE and the Middle East.
Project Details
- Duration: 2+ Months
Technologies:
- Python
- MSSQL
- Plotly
- PyQT
This is an Industrial Automation and Robotics Solutions provider company, especially in the manufacturing sector in the market of UAE and the Middle East.
Technologies:
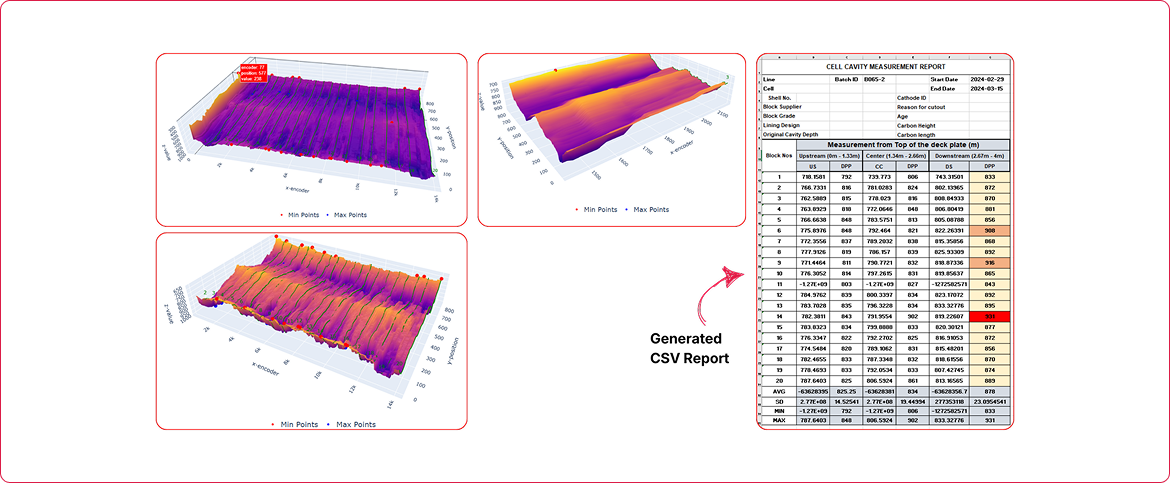
We developed a desktop-based 3D data visualization and analysis tool for surface pit evaluation.
CSV Report
Deepest points in each cathode.
Average depth, standard deviation, etc.

Stay updated with the trending and most impactful tech insights. Check out the expert analyses, real-world applications, and forward-thinking ideas that shape the future of AI Computer Vision and innovation.
Steel is required in construction, transport, and numerous other fields, whereas heavy machineries are required in fields like construction, mining, and many more activities; These two industries play a very crucial part for others as well, but both sectors come with their own challenges and concerns regarding safety, inefficiency, and high costs. Where AI vision […]

CEO & Co-founder
Some achievements do not arrive with loud announcements or dramatic celebrations. They arrive quietly, almost gently, carrying a kind of weight that only people close to the work fully understand. WebOccult’s Best Paper recognition at the IEEE was one such moment. Out of more than 450 research papers submitted from across the world, only five […]

CEO & Co-founder
People usually don’t think about logistics until there’s a delay in order delivery. On the other hand, there are millions of products that move across borders every single day, as their journey includes going through different ports, warehouses and distribution centres before the product reaches its respective owner. So there’s a lot that happens behind […]

CEO & Co-founder